The dominance of the 30-year fixed
rate mortgage is a defining feature of the United States’ housing market.
For a brief period in the mid-2000s, however, this dominance was challenged by
the popularity of non-traditional mortgage products that allowed borrowers
easier access to credit through variable interest rates with teaser periods,
extended terms, and interest only or negatively amortizing repayment schedules.
In effect, borrowers could obtain a mortgage with lower monthly payments in the
short-term than were available through the 30-year fixed rate mortgage.
As Figure
1 shows, the share of mortgages with at least one non-traditional feature grew
sharply during the last decade. At their peak in 2005, about sixty percent of
all purchase loans in the United States included at least one non-traditional
feature. Their coincidence with rapid house price appreciation during the
housing boom led many to conclude that they were used to speculate on the
housing market and, thus, partly to blame for the boom. However, given that incomes rose little duringthat period,
borrowers may have instead flocked to non-traditional mortgage products to
maintain affordability in a time of increasing home prices.
In a new CEP Discussion Paper, Affordability, Financial Innovation and the Start of the Housing Boom my coauthors and I study the relationship between the start of the housing boom and the use of non-traditional mortgages.
 |
| Figure 1 – Share of mortgages with non-traditional features and national house prices |
In a new CEP Discussion Paper, Affordability, Financial Innovation and the Start of the Housing Boom my coauthors and I study the relationship between the start of the housing boom and the use of non-traditional mortgages.
To do so, we first identify the starts of housing booms in individual US counties. Figure 2 shows substantial variation in the timing and size of local house price booms. Next, we use this variability to systematically track the use of non-traditional mortgage products around the local housing boom starts. To illustrate, the house price index for Clark County (containing Las Vegas) is shown in Figure 3(a). Our methodology estimates that the Clark County housing boom began in February 2004. In the figure, there is a clear difference in the house price path and appreciation on either side of the estimated housing boom start. In Clark County, we find that the rapid adoption of non-traditional mortgage products began earlier than the estimated start of the local housing boom (shown in Figure 3(b)).
 |
| Figure 2 – Distribution of House Price Breaks |
 |
| Figure 3a - Clark County Estimated House Price Break and Non-traditional Mortgages, Estimated House Price Break |
 |
| Figure 3b - Clark County Estimated House Price Break and Non-traditional Mortgages, Use of Alternative Mortgage Products |
Like in the experience of Clark County, we find that the increased use of non-traditional mortgage products preceded the accelerated rise of house prices in markets with house price booms that began after the year 2000. In the year before, the share of new purchase mortgages with any non-traditional feature increased 5 percentage points on average, primarily due to the use of variable rate and interest-only mortgage products. Moreover, in late-booming markets, we find results consistent with other findings, that lenders altered their loan supply along dimensions that would be less frequently and consistently reported to investors, such as denial rates and the share of loans classified as subprime. Overall, these findings support the view that financial innovation in the 2000s contributed to rising house prices by reducing payment constraints.
A key
question regarding the county-level patterns we document is: what mechanism
drove the expansion of non-traditional mortgage products in markets after 2000?
To answer this question, we exploit the dramatic increase in Treasury rates in
mid-2003 for plausibly externally influenced variation in lenders' financing
constraints. Earlier work shows that in response to the higher
Treasury rates and concurrent collapse of mortgage refinancings, lenders
rapidly expanded their use of the private mortgage backed securities to finance
new mortgage originations. This led to a sharper increase in mortgage supply
and house prices in markets with higher shares of lenders connected to the
private secondary market -- that is, those lenders that relied more on non-core
deposits (funding outside deposits from retail customers) prior to the increase
in Treasury rates.
In Figure
4, we show that, in addition to higher prices (panel (a)), counties exposed to
a higher share of non-deposit lenders also experienced an immediate increase in
the use of non-traditional mortgage products following the 2003 increase (panel
(b)). Notably, while the growth in non-traditional mortgage products is
instantaneous in mid-2003, house prices appreciate most sharply in the top
three quartiles of the non-core deposit distribution of counties, but only
after 6--12 months. In addition, across each quartile, growth in alternative
mortgage products increased monotonically with the share of non-deposit
lenders. This pattern suggests that an important mechanism during the 2000s was
an external shock to lenders' cost of capital that drove them toward the
secondary market, where non-traditional products flourished.
However, we uncover a stark difference in the systematic relationship across markets with a house price boom that started before 2000. In these markets, non-traditional mortgage products emerge as unlikely contributors to county-specific starts in booms. In addition, we find little evidence of credit supply growth in the years immediately before or after the start of these booms. We also find evidence that incomes in these markets grew faster than the national trend in the years before a local boom. These results suggest that the impetus for the housing booms of the late 1990s were driven more by economic fundamentals and that borrowers turned to these products to maintain affordability.
 |
| Figure 4a - Appreciation and Alternative Finance by Non-Core Lending Quartile, House Price Appreciation |
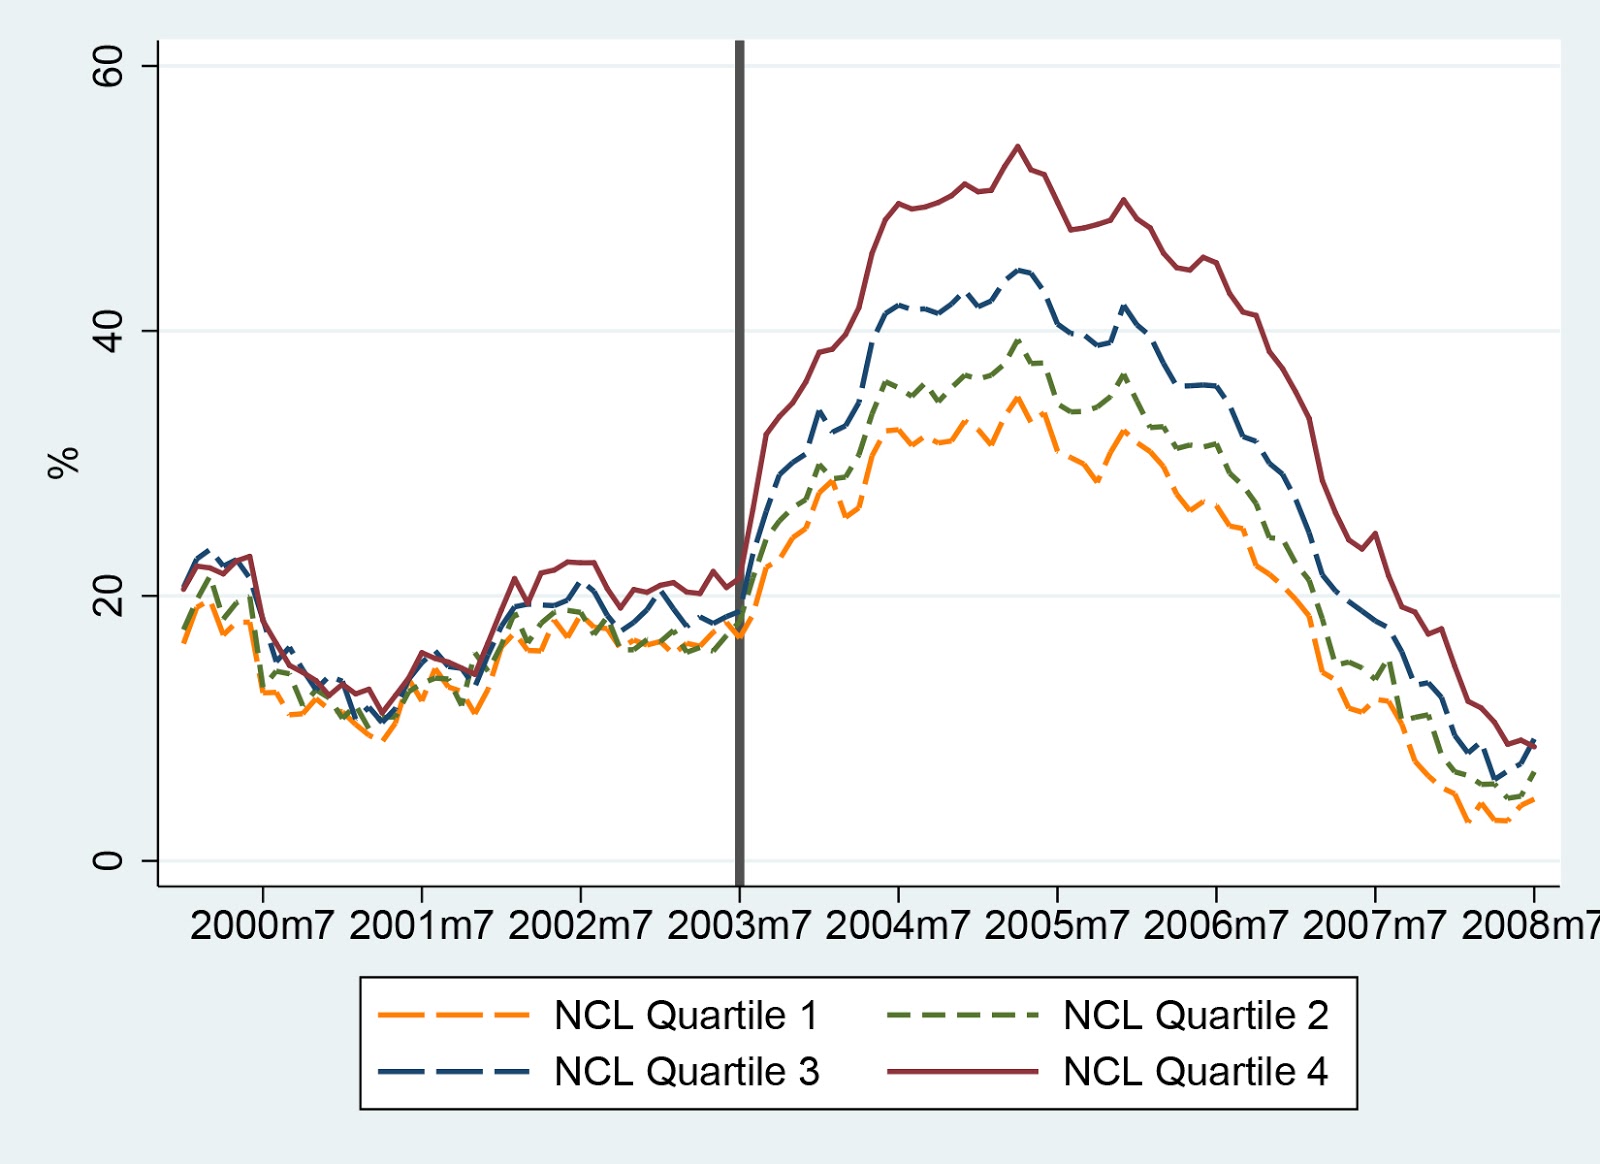 |
| Figure 4b - Appreciation and Alternative Finance by Non-Core Lending Quartile, Use of non-traditional mortgage products |
However, we uncover a stark difference in the systematic relationship across markets with a house price boom that started before 2000. In these markets, non-traditional mortgage products emerge as unlikely contributors to county-specific starts in booms. In addition, we find little evidence of credit supply growth in the years immediately before or after the start of these booms. We also find evidence that incomes in these markets grew faster than the national trend in the years before a local boom. These results suggest that the impetus for the housing booms of the late 1990s were driven more by economic fundamentals and that borrowers turned to these products to maintain affordability.
In the wake of the crisis, regulators have placed significant limitations on a number of non-traditional mortgage features by excluding them from the definition of a “Qualified Mortgage” for regulatory purposes. As laid out by the Consumer Financial Protection Bureau in their January 2013 report, lenders will no longer be able to underwrite a qualified mortgage loan based on a “teaser” rate in determining the ability to pay. Moreover, mortgages cannot contain interest-only, have lower payments than the interest due, or extended term features if lenders want to meet the legal presumption of complying with the qualified mortgage regulation.
As we have shown, whether restricting these contract features will affect the formation and magnitude of housing price cycles in the future depends crucially on the context of the use of these features. Although these rules have only recently come into effect, the consequences of limiting these products is also likely to reduce credit access for some households, while guiding others into more standard contracts.
Additional info:
This article is based on the CEP Discussion Paper, ‘Affordability, Financial Innovation and the Start of the Housing Boom’
About the author
Lindsay Relihan – LSE Geography and Environment
Lindsay Relihan is an Assistant Professor of Real Estate Economics and Finance at the London School of Economics. She is an applied microeconomist with interests in urban economics, household finance, housing, and real estate. Her research agenda is focused on understanding how the spatial relationships between firms and consumers shape outcomes in consumer credit markets.


