[Posted by Prof Henry G. Overman]
I've spent a lot of time over the last seven years (since SERC was founded) thinking about how urban economics can help improve urban policy. As part of that, I've helped specific cities and LEPs develop their evidence base and think about policy implementation (particularly Manchester, but also North East LEP, Birmingham, Great Cambridge / Greater Peterborough). I've also provided advice to BIS and Cabinet Office on the implementation of City Deals.
Recently, however, I've had an opportunity to move beyond this urban focus to think about the challenges facing the 'non-mets': the places outside our metropolitan areas that produce roughly half of England's GDP. The challenges these places face, and some of the potential solutions, are discussed in the interim report of the Independent Commission on Economic Growth and the Future of Public Services in Non-Metropolitan England (I'm one of the commissioners).
We're working on refining our recommendations over the next couple of months. As the report makes clear - there are some big questions still to answer - not least about how we might reform the relationship between central and (non-metropolitan) local government. I know that many people would like to see wholesale reform in this area. But there's also the possibility of an 'earned autonomy' model for non-mets that would parallel the process that has seen Manchester the first of the mets to be handed stronger powers (with Leeds, Sheffield and perhaps others to follow). I imagine many heated debates to come as we try to resolve this and a range of other crucial questions. Do get in touch with the commission [nonmet_commission@local.gov.uk] if you'd like to know how you can contribute to those discussions.
CEP Urban and Spatial Programme Blog (formerly SERC)
Monday, 24 November 2014
Tuesday, 11 November 2014
Building homes where we need them
Finally had a chance to catch-up with Centre for Cities report on where to build homes for Britain's most successful cities.
In the ten least affordable (British) cities building out every brownfield site delivers a total of 425,000 extra houses. If you go outside of their existing built-up area and use land within 25 minute walk of an existing train station you could add up to 1.4 million new homes (at reasonable densities). If neighbouring authorities could be made to cooperate that total rises to 3.4 million homes within 2 km of existing train stations.
The trouble, of course, is that those 3.4 million homes (within walking distance of existing infrastructure) would need to be built on green-belt land. In total, around 12.5% of the green belt land around those cities would be needed for development.
Achieving agreement on this scale of development on green belt land will clearly be difficult. Although, as the report notes, developing brownfield land can be a complex process and may require cities to take additional actions (e.g. land assembly) and investment (e.g. new infrastructure). And that brownfield land is only capable of delivering a fraction of the homes that could be built around existing infrastructure in the greenbelt.
In short, as the report makes clear, both options have their challenges, but making housing more affordable in our most successful cities will require a more sensible debate to designate land on its merits rather than according to whether it is currently designated as brown or green field.
Monday, 10 November 2014
Who buys new homes in London?
There's some interesting figures in this British Property Federation report from earlier this year on purchases of new homes in London (which I somehow missed first time round).
Headline figure is that various forms of investor acquire around 60% of new units with owner occupiers taking 40%. Around half of those investor purchases are by overseas buyers (defined as buyers who are normally registered as overseas). There's little evidence that those overseas buyers are leaving properties empty.
There are interesting variations across price ranges and locations - with owner occupiers acquiring around 80% of sub £450 per square foot properties (mostly in outer London) but only around 30% of £1,000-£1,500 per square foot properties (mostly in inner and 'prime' central London).
Overseas buyer activity varies by location as well - accounting for 50% of prime, 20% of inner London and only 7% of outer London (I think this is totals of investors and owner occupiers).
As always, figures from the property industry come with a big fat health warning (there's lots of private data and expert adjustments in use here) but I still found the overall numbers interesting - and a useful counter point to some of the media reporting which suggests much more overseas buyer activity.
Monday, 27 October 2014
Can 'Tech North' take off?
Posted by Dr Max Nathan, SERC and NIESR
Rory Cellan-Jones has a nice article on the BBC website on the prospects for the Government’s ‘Tech North’ initiative, building extensively from my work with Emma Vandore on Tech City in London. Here’s some further thoughts.
Tech North was launched by Nick Clegg last week: it’s one of the products of the DPM’s recent Northern Futures initiative. The idea is to promote tech clusters in Liverpool, Manchester, Sheffield, Leeds and Newcastle: Clegg has put £2m/year on the table to support local firms, and to attract FDI to the area.
Politically this is a no brainer. It meshes with the government’s ‘rebalancing’ rhetoric. And it fits the new mission of TechCity UK, which has expanded its remit from just East London to cover the whole country. TCUK is publishing work next month looking at digital clusters, which will put some new numbers behind the policy.
*
So will it work? Rory is fairly sceptical in his piece. I’m still unclear what the programme will actually do: so here are five issues policymakers should be thinking about.
1/ Real geographies – Tech North connects five big cities with over 150 miles between them. In the real world, urban tech is in very tight microclusters: neighbourhood scale scenes which allow for lots of face to face contact. In Liverpool, for example, a lot of the action is in Ropewalks or the Baltic Triangle.
In London, Ministers originally hoped to ‘connect’ the Shoreditch cluster to the Olympic Park a few miles away. That hasn’t proved possible, not least because Old Street firms didn’t want to move there and saw no connection between the two.
So the chances of creating a single super hub across the Pennines are slim at best. There are worrying echoes of the Thames Gateway here: a planning concept, not a real place. On the other hand, as we found in London, the area branding might prove a helpful way to raise the profile of these local scenes.
2/ Who’s in and who’s out? The DPM seems to have focused his attention on the five Northern core cities. Fair enough, in that these are the economic powerhouses of their wider regions. But the real geography of tech activity is a little different. But cities like York and Sunderland also have quite a lot of tech firms. So why aren’t they included?
3/ FDI versus growing our own – firms cluster because co-location makes sense: they can tap into new ideas and pools of skilled workers and can share useful inputs (like fast broadband or VC investors). On the other hand, as Henry Overman and I have argued, clusters have tensions built in. As more firms enter, pressures on space build up, so rents rise. And competition rises, for staff and for market share.
Given all this, it’s risky to base cluster development policies on foreign investment. If FDI simply brings in big multinationals, these might displace smaller, younger UK businesses. Even if this raises aggregate productivity, I doubt it's what Government or cities want in this case. Agencies like UKTI typically try and maximise the count and size of foreign investments. A different approach is needed here, which is to focus on the type of foreign inputs.
4/ Infrastructures – specifically FDI programmes should try and enrich the rest of the ecosystem, especially specialist services tech firms need: finance, lawyers, accountants and workspaces. This stuff is only just starting to appear in London at scale, and is likely to be a priority for other UK cities. Certainly, the UK’s VC scene has been pretty weak outside the capital.
Equally, fast internet (and fast connection to it) is a basic need. For me, this is now a public utility, so it’s disappointing that the Superconnected Cities scheme has retreated from rolling out faster systems to everyone, to simply providing vouchers to SMEs. The CORE programme in York, Peterborough and Derby is an interesting exception (thanks to Tom Forth for the link).
5/ Policy architecture (and whether it really matters) – cluster policy advocates like Michael Porter assume that cluster development has to be local, since clusters are local phenomena. But this doesn’t follow.
First, Tech North has little cash on the table: strikingly, its five-city budget is about the same as the original budget for East London.
Second, a lot of the relevant policy levers are held at national level: tax breaks for investors, crowdfunding regulation, immigration and skills. That still leaves some local levers: branding, networking, planning and any local investment pots. But it’s limited stuff.
Arguably some of these national levers should be devolved: that’s started to happen through City Deals and Local Growth Deals. But we’re at the very start of this process, and though the post-Scotland moment may yet shake things up further, what Ministers are handing over in powers they’re largely taking away in cuts.
But perhaps that’s too pessimistic. As Emma and I found in the East London research, the Old St scene grew quietly for years without policymakers really noticing. That could well be the likely trajectory for the many clusters under the Tech North umbrella.
Originally posted on the squareglasses blog.
Friday, 3 October 2014
Agglomeration Economies
[Posted by Prof Henry G. Overman]
I've been reading some of the recent material from the Foresight project on cities. In particular, I've been looking at the interesting piece by Ron Martin, Ben Gardiner and Peter Tyler on the long run economic growth performance of UK cities.
While there's much of interest in this paper, there are also a few things that puzzle me - and this blog is about one of them. Specifically, I'm puzzled by the suggestion that ("the New Neoclassical") Urban Economics predicts a positive link between size and economic growth. Or, as the paper puts it: "It is often argued that larger cities confer greater economies of agglomeration and increasing returns effects, and that, holding other things constant, these effects make for faster growth: in other words, that city size, agglomeration and growth form a process of circular and cumulative causation."
To my mind, this 'prediction' is muddling growth and levels. There is a large body of theoretical and empirical literature that suggests that, everything else equal, productivity will be higher in larger cities. It's also true that this literature supports the idea that initial shocks might be magnified by cumulative causation as the urban system adjusts to the shock. So, for example, a city experiencing a positive productivity shock might see a long run effect that is larger than the initial shock (as it attracts more workers and firms). This cumulative causation would, however, run its course once the city had adjusted. In the real world, this could show up as faster 'growth' over a number of years for a city experiencing a positive (productivity) shock.
However, when we switch to long run growth - i.e. to truly dynamic processes that may take place over decades - the link to size is much weaker both theoretically and empirically. Indeed, while some theoretical papers suggest a positive link, there's a growing empirical literature that suggests there may be no relationship. In particular, starting with a paper by Xavier Gabaix in the Quarterly Journal of Economics there's been considerable interest in whether Gibrat's law - which says that there is no link between city size and growth - explains the tendency of city systems to follow Zipf's law (a power law that links the relative size of cities). In an early empirical contribution to this literature, myself and Yannis Ioannides provided evidence to suggest that cities in the US system do indeed follow Gibrat's law. More recently, I've done work with Sabine D'Costa which suggests that for the UK there is very little evidence of any link from city size to wage growth (even thought there is a strong link for wage levels).
In short, the idea that there is no link between city growth and city size is a fairly mainstream 'neoclassical' position - and one that would reflect my own reading of the empirical literature (and indeed some of my own empirical work). So it's surprising to see the lack of a link between size and long run growth presented as somehow presenting a challenge to urban economists like myself.
Part of the muddle here, I suspect, comes in the translation to policy discussions where there has been a tendency to conflate growth and levels effects. I've personally tried to avoid doing this in my policy orientated writings. For example, our work for the Manchester Independent Economic Review was concerned with the productivity advantage that Manchester had relative to the wider region - but this was a statement about levels not growth rates. But it's an easy slip to make when discussing complex issues but trying to use non-technical language.
All of this also raises the much more important question of the implications for urban policy. At any point in time, the urban system is likely to have some large cities that are doing well and some that are doing badly (both in terms of growth and levels). The same is true for small and medium size cities. This reminds us that basing policy on size, per-se, isn't very sensible unless size correlates with some other important considerations - e.g. governance. This is why, for example, some of us pushed very hard to have the second round of English city deals focus on some of the smaller cities that were fast growing rather than just focusing on the (next ten) biggest cities.
But neither does the lack of a link suggest that we should completely ignore the issue of size. If, for example, the government wants to have a northern city to act as a counterbalance to London then it may make sense to focus investment in a place (e.g. Manchester) that is relatively large and has relatively high productivity. The hope would then be that agglomeration economies might generate a cumulative causation process that helped further the positive impact of that investment. Whether this would happen in practice depends on the extent to which policy can generate productivity increases, whether congestion costs increase quickly or slowly, etc. If it was successful, the effects would show up as faster growth for Manchester in the short to medium run, but (as the data make clear) not necessarily in the long run.
So the link between size, productivity and growth does matter for policy, even if - as seems likely - there is not a strong link between city size and long run growth.
Tuesday, 9 September 2014
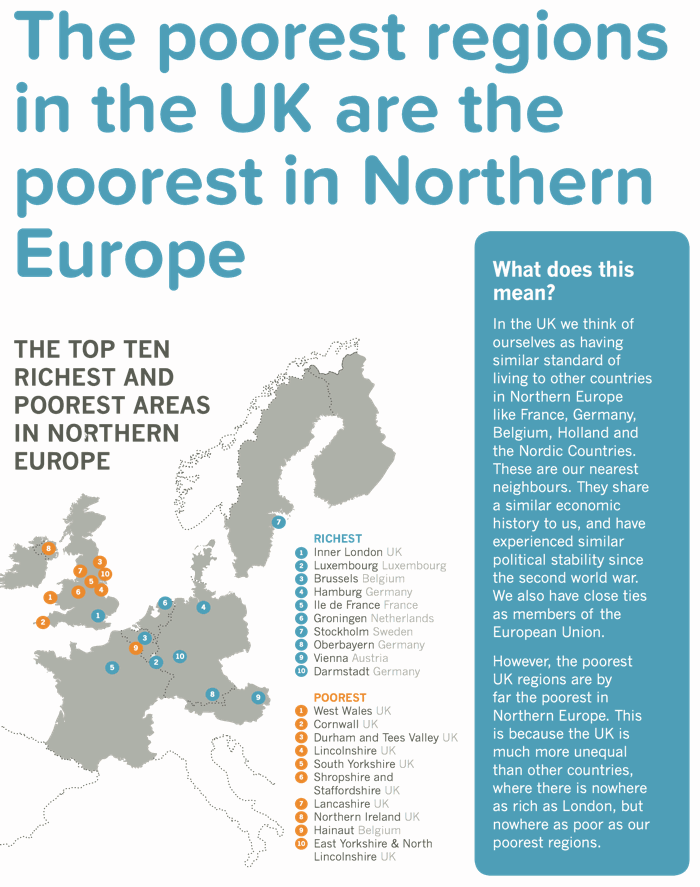
Why are the poorest regions in the UK the poorest regions in Northern Europe?
[Posted by Prof Henry G. Overman]
A few weeks ago the map below showed up in my twitter stream. It had been retweeted hundreds of times. At the time, I meant to write a post on the numbers behind the map. In particular, I wanted to take issue with what it tells us. According to the side bar: "The poorest UK regions are by far the poorest in Northern Europe. This is because the UK is much more unequal than all other countries, where there is nowhere as rich as London, but nowhere as poor as our poorest neighbours"
You can read this statement in two ways. One is simply providing the description of the map - we have very rich and poor regions so we are unequal. The other is to view it causally - the fact that we have high inequality explains why we have the poorest regions in Northern Europe. Unfortunately, the underlying numbers raise questions about both these interpretations (although the second one is particularly problematic).
Let's start with the claim that 'there is nowhere in Northern Europe that is as rich as London'. Unfortunately, this is not what the map shows. The map shows that INNER London has the highest GDP per capita calculated (on a PPS basis). This is three times the UK average. I find it worrying that people think this figure could possibly be correct. Of course, it's not for reasons that are a little, but not very, technical.
To see why this is a problem you need to know a little about how these statistics are calculated and something about the slightly weird geography of EU NUTS2 regions (on which the map is based). The GDP per capita figures allocate output on a workplace basis but population on a residence basis
The crucial issue is that Inner London is an administrative construct, not an economic one. That means that there is lots of commuting across the border of Inner London and, as the original data source makes very clear, "in some regions the GDP per capita figures can be significantly influenced by commuter flows. Net commuter inflows in these regions push up production to a level that could not be achieved by the resident active population on its own". That explains why the London figure looks so crazily high - because it ignores all the commuters who help produce inner London's output.
This is a bigger issue for Inner London than for some other rich EU areas. For example, according to the EU data that are used for this map, London has a population of 3m. In contrast, the Ile de France region has a population of 11m. All of this means that sensible comparisons need to correct for commuting - which I'll do the easy way by simply averaging Inner and outer London. This puts it on a par with Paris (at around 180% of the EU average) but below Luxembourg, Brussels and Hamburg. Of course, some of those regions probably need correcting to - but my point is that the data vastly overestimates London's income - and that you'd want to take account of that before reaching conclusions that 'nowhere is as rich as London'.
Next, is it the case that the UK is much more unequal than all other countries on this map? Here, the answer from the academic literature is that we are certainly more unequal. Whether we are much more unequal is open to debate. Regardless, does this level of inequality explain why the UK has the poorest 10 regions in this selection of Northern countries? It plays a part, but so too does the fact that we also have the lowest average GDP per capita (on a PPS basis). Indeed, the UK average level of income would rank it lower than the poorest Swedish region, poorer than all but a handful of Austrian, Finnish, Danish and Dutch regions (I count 6 in total) without any need to take in to account the level of inequality. In short we have lots of regions in the bottom 10 because we have both lower average income and higher inequality. There's no clean answer as to how much of this map is explained by low average income versus higher inequality. You could think of ways to try to get at it - taking, say, the level of inequality in other countries and applying it to the UK - but you certainly can't identify the separate role of average income and inequality on the basis of the map alone.
If you want an analogy, this is little like taking a primary school, finding that the ten smallest kids are in year one and attributing this to inequality amongst five year olds. [I'd be surprised to see hundreds of people retweeting that study].
One final issue is the use of GDP per capita in PPS. As the statistical note states: "GDP does not measure the income ultimately available to private households in a region" so I am not quite sure in what sense the map even shows 'poorest' and 'richest' regions. Worse, the PPS calculation is done at national, not local level. So this comparison is on nominal not real standards of living - so completely ignores the fact that London is a very expensive city relative to most other EU regions (including those in the UK).
In short, the map is a pretty misleading visual aid. Of course, we all use these kind of tricks to get people talking about important issues (like spatial disparities in the UK). The danger here, however, is that an awful lot of people (some of whom should know better) seem to take this map as showing that 1) London is the richest region in the EU; 2) High inequality explains why we have the poorest regions in Northern Europe. Unfortunately it does nothing of the kind.
Friday, 5 September 2014
Garden Cities
[Posted by Prof Henry G. Overman]
I'm fairly ambivelant about Garden Cities. We clearly need additional housing. The idea of finding some fast growing urban area, taking a bit of greenbelt land and building decent housing on it with good transport links and open spaces would probably help (such a suggestion won the Wolfson Prize). Whether it's the solution to our housing supply problems is another matter. I'd certainly want to see whether such a development proved attractive to people in general (rather than to the people who designed it) before rolling it out across the country. I'm also a believer in properly incentivising local people to agree to development - so I don't like the idea of a blue print that we'd impose on lots of places.
However, while I may be ambivelant about Garden Cities, I find our housing minister's response to the Wolfson Prize deeply depressing. According to the Independent: "the Housing minister, Brandon Lewis, has now condemned the scheme as “urban sprawl” that would build nothing other than “resentment” among local people and has said the Government would have nothing to do with it."
We have to stop this knee jerk reaction - that anything built on the green-belt is urban sprawl - if we are going to have a proper debate about increasing housing supply. Historically, towns and cities have had to accomodate some of their growth by expanding outwards. A sensible housing policy would allow for this, while also ensuring that huge amounts of countryside are not swallowed up by very low density housing (the real urban sprawl that we see in so many US cities)*. You would hope that a sensible housing minister would recognise this and try to do more to encourage considered debate about how to meet our housing needs. On the basis of his reported comments (assuming accurate) our current housing minister fails that test.
--
* Interestingly, even in the US, some of the claims about urban sprawl may be overstated. For example, in a 2005 paper in the Quarterly Journal of Economics we found little evidence that urban sprawl was increasing at the metro level. Using remote-sensing data to track the evolution of land use on a grid of 8.7 billion 30 × 30 meter cells, we measured sprawl as the amount of undeveloped land surrounding an average urban dwelling. Our findings suggested that the extent of sprawl remained roughly unchanged between 1976 and 1992 (although it varied dramatically across metropolitan areas). Of course, new development does tend to be less dense. But when you zoom out to the metro level you find that infilling of what used to be the urban fringe tended to leave a very similar pattern of development - just one that occured on a larger scale to house new population.
Thursday, 21 August 2014
Foreign buyers and property markets
[Posted by Prof Henry G. Overman]
In May last year, I did some back of the envelope numbers on the role of foreign buyers in driving the London property market. On the basis of a very quick calculation I concluded that "domestic sources of demand (including from first time buyers) are much more important in understanding the overall London property market than a small number of rich foreigners."
I haven't revisted these numbers, but was interested to read the following in Thomas Piketty's Capital (p463-4):
--
The rich countries are not about to be taken over by the poor countries, which would have to get much richer to do anything of the kind, and that will take many more decades.
What then, is the source of this fear, this feeling of dispossession, which is partly irrational? Part of the reason is no doubt the universal tendency to look elsewhere for the source of domestic difficulties. For example, many people in France believe that rich foreign buyers are responsible for the skyrocketing price of Paris real state. When one looks closely at who is buying what type of apartment , however, one finds that the increase in the number of foreign (or foreign-resident) buyers can explain barely 3 percent of the price increase. In other words, 97 percent of today's very high real estate prices are due to the fact that there are enough French buyers residing in France who are prosperous enough to pay such large amounts for property.
--
This is certainly in line with my priors but I'd love to see similar calculations for London.
[The source for the precise 3% figure is a PhD thesis that proved to be beyond my (miserable) French - I'm not aware of anything similar for London].
Tuesday, 5 August 2014
How to roll out high speed broadband in Britain
Posted by Gabriel Ahlfeldt, LSE and SERC
Across the globe, governments are looking for ways to roll out reliable and fast internet access. Broadband is central to this ambition. For example, the European Commission’s ambition is that at least 50% of European households should have Internet connections above 100 Mbit/s by 2020. In the UK, the Coalition wants superfast broadband access for 95% of households by 2017, with a particular focus on cities. That’s drawn some flak from rural communities, many of whom exist on very slow connections.
To an economist, such officially defined targets imply that governments see significant externalities from broadband provision, and that if left to markets, too many households would be left in the slow lane. However, putting a number on these spillover benefits is very hard. In turn, that leaves it unclear whether publicly subsidized improvements in broadband infrastructure really are socially desirable.
I’ve just released this research, in which my co-authors Pantelis Koutroumpis and Tommaso Valletti and I try to quantify broadband’s benefits to households. We were particularly interested in the benefit users derive from internet usage above and beyond what they pay to their internet service provider (ISP). Measuring this ‘consumer surplus’, however, is difficult because we can’t directly observe what people would be willing to pay.
To get around this, we argue that it is possible to indirectly infer the consumer surplus from property prices. In the UK every property is connected to one and only one internet delivery point - the local exchange (LE). Actual broadband speed critically depends on the distance of a property to its LE and the technology of the LE: fast connections need a property close to an LE, and for the LE to have fast hardware. All else equal, properties at such favourable locations will be more attractive and, as a result, will sell at higher prices. The value of a decent internet connection can therefore be inferred from a comparison of property prices across locations, controlling for other factors.
Econometrically, there are two challenges with this approach. Firstly, there will always be some factors that shift property values and are unobservable in the data. Secondly, neighbourhood-level changes can lead ISPs to upgrade their LEs and at the same time cause house prices to increase. Our identification strategy addresses both concerns. Our most restrictive empirical models identify the broadband premium from changes in broadband speed and house prices over time and across LE boundaries. We compare properties that are located within a couple of hundred meters, but within different LE catchment areas – see figure. Within such a small range it is unlikely that distinct changes in speed that result from different upgrades in the two different LEs will be confounded with other changes in the neighbourhood.

Using this strategy we identify the causal effect of broadband speed on property prices, from about 1m property transactions between 1995 and 2010, and three LE upgrade waves covering around 4000 exchanges. We find that property prices increase on average by about 3 per cent when internet speed doubles. Importantly, there are diminishing returns to speed. While the increase in value is even greater when starting from slow internet connections, an increase in nominal speed from 8 to 24 megabits per second raises the property value by no more than 1%.
Another main finding is that the consumer surplus differs substantially across regions. It is highest in high income areas that are highly urbanized. As an example, the consumer surplus in London is almost twice as high as in any other of the English regions, reflecting very high usage in the capital city for both work and personal reasons.
We use these estimates to compute the aggregate consumer surplus from taking all UK households on broadband to the 30 mbit/s target envisioned by the EC. Comparing the results to engineering cost estimates, we find that urban areas pass the cost benefit test by a large margin. The opposite is true for rural areas. This is partially because the benefits in these areas are lowest, and partially because the costs are highest.
These results suggest that in rural areas it makes more sense for governments to adopt less expensive fixed and mobile technologies that deliver decent and reliable speed. For urban areas, super-fast broadband is an economically viable technology. An equity issue arises, however, if all taxpayers pay for a subsidized rollout, but landlords in the targeted areas accumulate a large fraction of the benefits. A levy on landlords could help promoting the rollout of fibre while at the same time saving taxpayers’ money and reducing inequalities.
Across the globe, governments are looking for ways to roll out reliable and fast internet access. Broadband is central to this ambition. For example, the European Commission’s ambition is that at least 50% of European households should have Internet connections above 100 Mbit/s by 2020. In the UK, the Coalition wants superfast broadband access for 95% of households by 2017, with a particular focus on cities. That’s drawn some flak from rural communities, many of whom exist on very slow connections.
To an economist, such officially defined targets imply that governments see significant externalities from broadband provision, and that if left to markets, too many households would be left in the slow lane. However, putting a number on these spillover benefits is very hard. In turn, that leaves it unclear whether publicly subsidized improvements in broadband infrastructure really are socially desirable.
I’ve just released this research, in which my co-authors Pantelis Koutroumpis and Tommaso Valletti and I try to quantify broadband’s benefits to households. We were particularly interested in the benefit users derive from internet usage above and beyond what they pay to their internet service provider (ISP). Measuring this ‘consumer surplus’, however, is difficult because we can’t directly observe what people would be willing to pay.
To get around this, we argue that it is possible to indirectly infer the consumer surplus from property prices. In the UK every property is connected to one and only one internet delivery point - the local exchange (LE). Actual broadband speed critically depends on the distance of a property to its LE and the technology of the LE: fast connections need a property close to an LE, and for the LE to have fast hardware. All else equal, properties at such favourable locations will be more attractive and, as a result, will sell at higher prices. The value of a decent internet connection can therefore be inferred from a comparison of property prices across locations, controlling for other factors.
Econometrically, there are two challenges with this approach. Firstly, there will always be some factors that shift property values and are unobservable in the data. Secondly, neighbourhood-level changes can lead ISPs to upgrade their LEs and at the same time cause house prices to increase. Our identification strategy addresses both concerns. Our most restrictive empirical models identify the broadband premium from changes in broadband speed and house prices over time and across LE boundaries. We compare properties that are located within a couple of hundred meters, but within different LE catchment areas – see figure. Within such a small range it is unlikely that distinct changes in speed that result from different upgrades in the two different LEs will be confounded with other changes in the neighbourhood.
Using this strategy we identify the causal effect of broadband speed on property prices, from about 1m property transactions between 1995 and 2010, and three LE upgrade waves covering around 4000 exchanges. We find that property prices increase on average by about 3 per cent when internet speed doubles. Importantly, there are diminishing returns to speed. While the increase in value is even greater when starting from slow internet connections, an increase in nominal speed from 8 to 24 megabits per second raises the property value by no more than 1%.
Another main finding is that the consumer surplus differs substantially across regions. It is highest in high income areas that are highly urbanized. As an example, the consumer surplus in London is almost twice as high as in any other of the English regions, reflecting very high usage in the capital city for both work and personal reasons.
We use these estimates to compute the aggregate consumer surplus from taking all UK households on broadband to the 30 mbit/s target envisioned by the EC. Comparing the results to engineering cost estimates, we find that urban areas pass the cost benefit test by a large margin. The opposite is true for rural areas. This is partially because the benefits in these areas are lowest, and partially because the costs are highest.
These results suggest that in rural areas it makes more sense for governments to adopt less expensive fixed and mobile technologies that deliver decent and reliable speed. For urban areas, super-fast broadband is an economically viable technology. An equity issue arises, however, if all taxpayers pay for a subsidized rollout, but landlords in the targeted areas accumulate a large fraction of the benefits. A levy on landlords could help promoting the rollout of fibre while at the same time saving taxpayers’ money and reducing inequalities.
Friday, 1 August 2014
Planning supermarkets away, for less convenience and variety, higher prices and lower productivity
[By Paul Cheshire and Christian Hilber]
One of the 'joys' of putting together a serious evidence based analysis of the effects of our planning system is to have planners turn round and dismiss the results because the analysis has not evaluated the benefits of planning. This is especially true since one of us was the first – and still one of the very few – to attempt rigorously to evaluate the net effects of restrictions on land supply; and found them to be substantial and negative in terms of their welfare effects.
The issue is in reality that very powerful and dirigiste planning policies are introduced with no attempt to analyse the value of either the benefits they might generate or the costs they impose. Because it is absurd to try to claim that planning policies do not have any costs it is surely better to have a reasonable measure of what those costs are so when we evaluate benefits – whether identified quantitatively or qualitatively – we can set the benefits against their costs. Otherwise it is rather like the ‘ladies’ menu in a posh restaurant. Great claims may be made for the dishes but it is not possible to make an informed choice of what to eat unless you know that the foie gras costs £45 while the excellent artichokes are a snip for a fiver.
Just such a policy is Town Centre First (TCF). The strict version was introduced almost on a whim in 1996 with the aim of concentrating new retail development on particular sites in central locations. One of the outcomes of this policy is highly visible: small local stores – such as Tesco Expresses or Sainsbury Locals – have mushroomed in locales that are deemed to be 'town centres' according to planners. At the same time, very few large scale supermarkets – built after 1996 – can be found out-of-town, where English households increasingly decide to live (ironically, in part this suburbanization is driven by planning restrictions in urban areas that make housing in those places increasingly unaffordable). This is because of the so called ‘sequential test’ that was designed to rule out all possible sites before allowing an out-of-town site even to be considered. The ultimate outcome of this has been that it became all but impossible to develop large format out-of-town stores in England after 1996.
There are a number of obvious adverse consequences of forcing retailing into small and often awkward sites in ‘town centres’: these locations will be less convenient for suburban shoppers (an ever growing share of the population) and the smaller stores will, compared to large format out-of-town stores, be able to offer less variety, at higher prices.
Another potential cost of TCF policy could be that it lowers efficiency by forcing stores onto more awkward and difficult to manage sites in intrinsically less productive locations. A major reason for their intrinsic lower productivity is likely to be the difficulty of supplying them efficiently. Supply depots remain located with respect to the motorway system and local planners and politicians (rather than retailers) choosing store sites in ‘town centres’ is not a recipe for efficiency. It is issues such as these that we explore in an article that is forthcoming in the Journal of Economic Geography.
Using unique store-specific data from one of the four largest supermarket chains in the UK and exploiting useful variation in TCF policies between England and Scotland and Northern Ireland – where TCF policies were introduced later and much less rigorously, especially in Northern Ireland - we identify the loss of output imposed by the implementation of TCF policy in England. Also we have data on how planning restrictiveness has varied across English Local Authorities (LAs) since 1979.
Our findings are staggering. The first is that the most restrictive LAs more or less plan supermarkets away from the communities they serve. A one standard deviation increase in the restrictiveness of a LA (which would move the LA from about average to be just in the top 15% in terms of restrictiveness) reduces the probability of their being a supermarket in it by 26%. Since more restrictive LAs also restrict the size of stores, the same increase in restrictiveness reduces the chain’s floor area in the more restrictive LA by 42%. The resulting scarcity of supermarket space does mean more sales per sq ft of floor area so the chains’ sales are reduced by ‘only’ 32% for a one SD increase in local planning restrictiveness.
Turning to the direct impact of TCF policy, according to our most conservative estimate, the implementation of strict TCF policy in 1996, combined with the initial effect of tightening controls on out-of-town stores in 1988, caused a total loss of sales of some 32%. This is the total loss of output, all else controlled for, observed in an English store opened after 1996 compared to stores that opened up prior to 1988 (when retailers in England were still pretty free to choose optimal locations) - equivalent to more than a lost decade of growth in retail output.
Our analysis suggests that the gross cost of constraining retail to sites and locations chosen by planners and local politicians rather than by retailers and shoppers, has a staggering price tag attached to it, up there with the £45 foie gras. Whether the price tag is too high depends of course on the benefits forcing retail to ‘town centres’ may deliver. The declared aim of TCF has been to make cities more ‘sustainable’ and retain access to shops for those without cars. To deliver any final verdict on TCF, these alleged benefits would also need to be rigorously quantified.
As it is they are no more than claims because there is no evidence they exist. This is what we are trying to do in an ongoing project. Our still provisional findings do not suggest that TCF policies ‘deliver the goods’. What we find is that, since TCF was strictly imposed in England, adding new stores in a local shopping area reduces distances travelled for shopping in both England and Scotland, but it has done so much more in Scotland. This is not really surprising. Whereas in Scotland retailers built stores where households increasingly live and want to shop (in suburban and ‘out-of-town’ locations), in England planners and local politicians have deliberately made this much more difficult; new stores are disproportionately on sites that are less convenient for shoppers. To be sure; some shoppers will be better off. One of us does not have a car and lives near a ‘town centre’ high street. He appreciates the additional stores. However, not many households own no car and live near ‘town centres’. So, while TCF may be the equivalent of a nice meal for a few, for most of us it is probably an empty plate: or to mix our fables - emperor’s clothes. Either way it seems to have a very high price tag attached to it.
Monday, 28 July 2014
Time for a more rational debate on 'mixing' in new developments?
[Posted by Prof Henry G. Overman]
I may have made this point before, but I would love to see more sensible discussion of policy around mixed housing developments. I was reminded of this by the Guardian headline on Saturday about 'Poor doors' which highlighted the segregation that goes on in some of these developments. Personally, I find such stories unpleasant, but not at all surprising. If you share that sentiment surpress, for a moment, your outrage and ask yourself the following question - if the uncomfortable truth is that wealthy people don't want to mix with their poor neighbours (and can't be forced to do so) then what, exactly does this policy achieve?
The first reason for encouraging such mixing draws on the literature about neighbourhood effects. The underlying theory is that this kind of mixing improves outcomes for poorer families. Unfortunately, the empirical evidence on this is surprisingly weak. There is evidence that families do better when they live in mixed neighbourhoods. But establishing that the causality runs from mixing to better outcomes (rather than the other way round) has proved difficult. The evidence that forcing mixing at such micro-scales (e.g. within the same blocks) improves outcomes is thin to non-existant. Perhaps not surprising when you start to think about the realities of mixing as highlighted by the Guardian article.
The second reason for forcing mixed units is that it allows local authorities to extract 'development' rents from the private sector. In other words, by forcing them to provide some social housing in exchange for permission to develop you increase the supply of social housing. But mixing per se need play no part in this. Indeed, the irony is that you could increase the amount extracted from private sector developers if we didn't insist on social units being delivered in the very same development as the private sector units. This in turn would allow us to fund more social housing provision than we achieve with the current arrangements.
In short, if forced mixing at the site level doesn't deliver clear benefits and reduces the 'tax' we can extract from developers - should we persist with it?
A few decades ago, we were providing poor quality social housing on large estates, often in areas poorly served by public transport and far away from employment opportunities. We clearly do not want to see a return to that. But policy now seems to have swung to the opposite extreme where it insists on having a mix of social and private housing in every single new development. There is little strong evidence to support such a policy - which suggests that the optimal policy may lie somewhere between these two extremes. Perhaps it's time we had a sensible debate that tried to figure out where the appropriate balance might lie?
Monday, 14 July 2014
Improving Voter Turnout
I don't have a strong view on police and crime commissioners. But looking at a recent article on the West Midlands by election I was intrigued to notice that "the Home Office has chosen to spend an extra £1 million on a pilot programme sending publicity booklets to every household in the region in an attempt to drum up interest in one of the coalition’s flagship policing policies."
Wearing my 'what works hat' I am spending a lot of time thinking about how to evaluate different kinds of policy so I wondered what the Home Office was trying to achieve with these booklets. Jim Waterson (who authored the original article) kindly sent me a link to the legislation that explains all:
"This trial will allow the Government to evaluate whether the delivery of election booklets to residential premises significantly raises voter awareness about the candidates standing in a PCC election."
This sounds potentially interesting - after all we'd like to know whether providing information to households improves awareness, perhaps even increasing their chances of voting. In order to figure that out we'd need to provide information to some households and not others and follow up to see whether households that got information had better awareness, voted more, etc. A second best alternative might be to have some areas receive leaflets others not. We would, of course, need to randomise this because selecting specific households or areas might give some candidates an advantage over others. However, with a big enough election randomising the provision of information shouldn't favour one candidate over another, but should increase turnout in the group getting leaflets relative to those that don't (if providing information helps).
Unfortunately, it appears that the 'pilot' in the West Midlands by-election won't allow us to do any of this because the leaflets are going to all residential addresses. Without a comparison group it will be impossible to figure out whether providing information has an effect on voter awareness or increases turnout. Even before and after comparisons for a sample of households won't tell us anything much given that coverage of the election should increase voter awareness over time.
I have no idea whether the electoral commission would allow randomisation of election information (there's a case that they should). Either way, in the absence of a suitable comparison group, it's difficult to see how the £1m pilot in the West Midlands can tell us anything useful.
Wednesday, 9 July 2014
Building on Greenbelt land: so where?
[Posted by Prof Paul Cheshire]
Almost every reasonable person must now accept the case that we need to build on some parts of currently designated Greenbelt land. Not everyone is, of course, reasonable; and many are reasonable but have special interests, indeed assets, to protect. Particularly because the value of these assets in part depends on local Greenbelt designation, moving from the general to the particular – where should we build – almost inevitably causes controversy. One of my favourite slogans is from a group called CLASH in St Albans ‘No to Greenbelt Development – HERE’. It is so nakedly honest in its NIMBYism. But here goes: the particular.
Well almost here goes, because in fact this blog starts with some of the salient general arguments about why we must build on Greenbelt land. Ever since Kate Barker’s 2003 review of housing supply it has been well understood that the supply of housing in Britain in general and in the South East in particular is morbidly inelastic. Rising prices just do not produce more house building in England and one of the results is ever more price volatility. We know we have an accumulated shortfall of supply over the past 20 years of some 1.6 to 2.3 million units and that in so far as we have been building houses they have been of the wrong type and in the wrong locations to meet demand.
It is true that there are several factors in this critical shortage of supply but the most fundamental problem is the restriction of land supply and the insistence on building on brownfields sites.
Back in 1999 Steve Sheppard and I did some work commissioned by the then DETR (later ODPM, now DCLG) to estimate the impact on house prices of alternative land supply scenarios, building up from individual observations of house transactions and households to estimate the structure of demand for housing attributes, including space inside houses and outside space in gardens. Since the incoming government had recently adopted – with no evidential basis at all – the target that 60% of new houses should be built on ‘brownfield’ sites we thought we should include that as one of our land release policy scenarios. The purpose of the model was to estimate impacts of various land supply options on the change in real house prices between 1996 and 2016 given the then current household number projections and trend increases in real incomes. According to our model the 60% brownfield target would generate a 132% increase in real house prices by 2016. In fact the 60% brownfield target has been exceeded although luckily (you might ironically say) trend real income growth has been a bit lower than we assumed.
There would seem to be two main lessons from this. The first is that to stabilise, even to slow the rate of increase of un-affordability – highlighted recently by the Deputy Governor of the Bank of England as posing the biggest single risk to the British economy – we have to build on Greenfield sites. That necessarily means parts of the Greenbelt particularly, since the strongest demand for housing is near to jobs and near to where houses are the most expensive.
The second – less obvious lesson – is that it is rising real incomes that really drive the increase in house prices, because the demand for space rises so rapidly as incomes rise. The 132% increase in real house prices assumed both the then forecast rate of increase in household numbers and the trend rate of increase in real incomes. Re-running the model with the same increase in household numbers but now assuming real incomes did not rise at all produced an estimate of only a 4.4% increase in real house prices over the same period 1996-2016. In other words almost all the action on house prices came from the increase in real incomes.
We all want incomes to rise. That means we have to accept that the demand for houses and particularly housing space, will continue to rise and unless we supply enough space to build houses the problems in the housing market, and likely the British economy, will become completely unmanageable. And in the long run the outcome – already highly inequitable – would be catastrophic.
So release land where? Being an academic I will again start from the general principles. First we need to get rid of the completely outmoded designations of land as ‘greenfield’, Greenbelt or ‘brownfield’. These do not correspond to the underlying environmental or amenity value of land and it is this with which public policy should concern itself. This was exactly the conclusion of the official enquiry into land use futures https://www.gov.uk/government/publications/land-use-futures-making-the-most-of-land-in-the-21st-century. Designations provide a handsome income for planning lawyers who can argue about whether a particular parcel is legally green or brown field till the cows come home; for example over the ex-MOD land I blogged about here.
The policy issue should not be the simplistic designation but the value of the land to the community in its present use over and above any market value of the land. So we need to get rid of these artificial legal designations and instead focus on preserving valuable habitats properly, improving the bio-diversity of land, preserving land with public access - indeed improving access where practicable - and preserving scenically valued land although this is already well protected in most cases by National Park status or being designated an Area of Outstanding Natural Beauty (a designation we should stick with even if sometimes fanciful on the margin). In summary – there is a strong welfare economics case for preserving large tracts of land in an unbuilt state, especially where there is public access or it has special habitat value.
The next set of general principles would seem to be first that the land is suitable for building – not in a floodplain or suffering from noxious pollution from past industrial activities. The second would be that the location gives good access to jobs and house prices are high, reflecting a local scarcity. A case on these grounds would be stronger still if the wider community had recently invested in improving local transport infrastructure. Finally the land should have low environmental or amenity value.
These simple principles quickly point to a plentiful – almost inexhaustible – supply of suitable land. Barney Stringer of QUOD generated a beautiful map recently identifying all the land in London’s 514,000 ha Greenbelt which was within 800 metres of a station (a ten minute walk), was not built on and had no marker of environmental quality beyond being in the Greenbelt. Barney calculates these simple criteria give us 19,334 hectares of highly buildable land with good access to the highest paying jobs in Europe and no identifiable environmental cost at all. I am no fan of mechanical densities especially since one of the problems with making land so expensive is that houses and gardens are much too small; but applying the current norm of 50 houses to the hectare this would give us space for 996,700 houses.
I would not stop at 800 metres though. The Dutch have shown the way in integrating cycling with using the train. The most modest cyclist can manage 2 kms in 10 minutes and still have time to lock up their bikes if the station has proper cycle facilities. I have not done the precise calculations but the laws of geometry being as they are using a 2km (10 minute) cycling distance would give one a total area 6.25 times bigger than Barney’s 800 metre radius. Some of the extra space would be environmentally valuable or not sensible to build on for other reasons and there would likely be just a little double counting but even so extending to 2 kms would more than double - probably triple - Barney’s estimate of 19,334 hectares available to build houses on in any sensible policy world. So even as things stand a sensible reappraisal of Greenbelt designation would solve the South East’s shortage of housing land overnight; and still leave London with at least 90% of the existing area covered by Greenbelt designation unbuilt on!
This, however, is based on the existing transport system. One of the sensible functions claimed for planning is the need to co-ordinate development with infrastructure provision. Presently we are building a major piece of new transport kit for the region: Crossrail. This is costing us £18 billion and will bring places like Iver or Taplow in Bucks or Shenfield in Essex within 30 to 40 minutes of central London (compared to the existing journey times of an hour to an hour and quarter). Have a look on Google Earth at the areas around these existing stations. The land around Iver in particular does not look too special. There is waste land aplenty, the M25 cuts through it and there is at least one golf course nearby. There is land around Taplow which looks to have environmental or scenic value but plenty which does not. Again Google Earth shows not one but two golf courses close by. The area around Shenfield is similar but here there seems to be more horseyculture than golf in the immediate vicinity.
Nothing wrong with golf or horsey culture but what we have to understand is that Greenbelt designation gives those land uses a massive subsidy. House building cannot compete for agricultural land but golf and horses can. I recently discovered another reason why we have so many golf courses around our cities: they are substitutes for landfill sites. It costs £80 a ton to dispose of ‘inert material’ in registered landfill sites but nothing if it goes into building bunkers! To quote Paul Robinson, Derby Council’s Strategic Director for Neighbourhoods, in defending the potential to capitalise on the value of the sites of the Councils two golf courses: "Effectively you go out to the waste industry and you say we will allow you to put your inert waste in our golf course…So you create mounds and bunker areas using the waste and at the core of those is inert waste." . This is one factor which underlies the proliferation of golf courses close to sources of builders’ waste and on land where there is no competition from houses. As noted in The Economist there is a serious oversupply of them. So the combination of Greenbelt designation and landfill costs means we can build as many golf courses as the market demands at their subsidised price but we cannot build houses. It is time to start turning some of our excess supply of golf courses into gardens; with houses on them!
The underlying logic here is that not only should there be good access but the land should have low environmental value. These criteria point to another good site for houses: outside Oxford to the north east of the by-pass beyond Marston. Why here? Houses and building land in Oxford are, after London, the most expensive in England; we may not be linking Oxford to London with Crossrail but we are electrifying the railway line without so far expanding housing. And the site I would build on is well above the flood plain and is mainly used for high intensity arable (as is 44% of Oxford’s Greenbelt). As we argued in our recent book intensive arable land has no value beyond its market price for farming (and even its market price is grossly inflated by subsidies and advantages for tax avoidance) since intensive farming imposes net environmental costs and the land used for it, apart from being nearly devoid of wildlife, has little access apart from viable rights of way.
So while we are looking for suitable sites for building we should not forget Cambridge. 74% of Cambridge’s Greenbelt is in intensive arable use and the local economy is thriving. Indeed some would claim it is one of the real showpieces of Britain’s future economic success. But lack of new housing shuts people out of this prosperity and labour shortages are a problem. There are plenty of locations to choose from but Google Earth suggests north and south of the axis from Cherry Hinton to Fulbourn would be as good as anywhere. It is elevated by the standards of the Cambridge area and - amazingly - has a large golf course ready for houses as well as many hectares of land used for intensive arable farming.
No doubt many people who live close to the locations identified here would rabidly oppose building or a loss of their Greenbelt protection. That is more or less inevitable given the system we have constructed. But it is close to insane to spend £18 billion on Crossrail and not take advantage of the tracts of land that will suddenly be within a short commute of Central London because in 1955 – before Crossrail was dreamt of, when London was staggering back to its feet after WWII and car ownership was less than a tenth as common as now – all the land around the outlying stations was declared off limits sine die. And after all houses on the Crossrail route or in Oxford are being made even more valuable because of the public investment in transport infrastructure. Maybe if the 1,584 citizens of Taplow are unwilling to accommodate more housing they should be taxed the increased value of their houses.
Monday, 7 July 2014
The irresistible pressure of economic fundamentals: Radical planning reform moving into the mainstream – but still need to get the details right
[Posted by Prof Paul Cheshire]
It was excellent to see concern and rational debate about the English housing crisis and its causes getting coverage in the mainstream press over the weekend. There was an ‘exclusive’ in the Sunday Express on 6th July, linking concerns about housing supply and the shortage of land produced by two generations of ‘urban containment’ with the Deputy Governor of the Bank of England’s warning that the housing market now posed the greatest single threat to economic recovery. Much of the piece was based on a phone conversation I had with the Whitehall correspondent, Marco Giannangeli.
No concerns about his representation of my basic message. But there were some issues with the details! Maybe it is the academic’s inner pedant; or the form of Chinese whispers which a phone conversation to a reporter, however skilled, who then writes his story which is then edited and subedited by people who have not heard the original conversation and finally cut to fit the space available given daily news pressures. Maybe the problem was that the season is not yet silly enough so there is still an awful lot of serious stuff happening in the world squeezing out other subjects.
Whatever. Here is a blog to alert readers to the interest of the Sunday Express in SERC research and correct a few misrepresentations in the story as it appeared in the paper compared to the conversation with Marco!
- The first was a classic confusion. There are 1.6 million hectares of Greenbelt land in England, not 1.6 billion. I think that 1.6 billion hectares is a good bit bigger than the entire USA.
- The published piece had me condemning the Help to Buy scheme out of hand as just inflating house prices. I was a bit more nuanced about HTB but these got lost. There are 2 separate schemes or elements to HTB. The first is aimed only at those buying new build houses. This may slightly increase supply. So it will not only have the effect of increasing house prices. But there is another separate scheme supporting anyone buying any house costing less than £600 000. That will have the effect of mainly increasing house prices. Together they certainly have the effect of increasing house prices and it is possible – we do not yet know because we do not have the evidence - that the net effect will be to make housing yet less affordable (i.e. not help, but hinder, buying; that depends on whether overall the increase in house prices the two schemes generate outweighs the help to the particular people who take advantage of the schemes). I first blogged about HTB immediately after the 2013 Budget.
- The published piece suggested I was arguing that we should release land for housing along the line of the proposed HS2 . I hope I was being more immediate and practical than this. HS2 will not increase the supply of land with good access to jobs in London much because – if built – it will have few stations. It might increase commuting from Birmingham to London of course. As SERC has warned ‘roads run two ways’. In the phone discussion about housing land I was talking about Crossrail . This is costing enough - around £18 billion to expect some community gain and is actually being built. From its opening in 2018 places like Iver or Taplow in Bucks or Shenfield in Essex will move to within 30 to 40 minutes of central London compared to the present journey times of 60 to 75 minutes. All three of these stations are within London’s Greenbelt. This means – despite the vast investment in a useful piece of infrastructure - no houses can be built close to them . So a potentially very useful and major piece of infrastructure will generate much less gain for the community than it should in any rational world. And this is despite the fact that there is plenty of environmentally pretty useless land close to the stations and the fact that the reduced journey times to London will substantially increase the value of houses close to the Crossrail stations.[ By the way I plan a blog shortly on where exactly one should be thinking about building houses in the Greenbelt and these three will certainly feature.]
- The Sunday Express piece did correctly report me as saying that 20% of the GLA area is covered by Greenbelt designation. But the idea we could build 1.6 million houses on this area of Greenbelt within London is far too mechanical. The total area of Greenbelt within the GLA boundary is 32,500 has. Currently expected densities (which are too high) are 50 houses to the ha so if every single m2 of Greenbelt land within the GLA was built on that would add to about 1.6 million houses but it is not at all reasonable to think that every available ha could or should be built on . We do need green spaces!
- There was also a confusion between Greenbelt area within the GLA (32,500 ha) and London’s Greenbelt. This stretches out to Aylesbury and Southend and covers about 514,000 ha in total – i.e. most of the Home Counties. It is this much bigger area (514,000 ha) that contains nearly 20,000 of Greenbelt land within 800 metres of a station not built on and not in an Area of Outstanding Natural Beauty or covered by a Site of Special Scientific Interest protection or any other indication that it is land which is environmentally valuable or amenity rich. Thanks to Barney Stringer for this statistic.
Wednesday, 25 June 2014
HS3 and a Northern Powerhouse
[Posted by Prof Henry G. Overman]
I have finally had a chance to take a look at George Osborne's 'Northern Powerhouse' speech in which he suggests that a better connected collection of northern cities could take on the world. It's an interesting (and not entirely new) proposition. But would it work? Could joining up northern cities replicate London's success?
Crucial to answering this question is the role that scale and physical proximity play in driving London's success. The evidence suggests that these are pretty important - agglomeration economies arising from scale and proximity help explain London's success.
Once we recognise this, it has fundamental implications for what a more balanced UK economy might need to look like. If creating similar opportunities to London requires similar scale and physical proximity, could we get anywhere near this by 'joining' up our Northern cities through greater infrastructure investment? I remain sceptical - not least because our work for the Northern Way estimating the impact of quite substantial reductions in travel times between Manchester and Leeds suggests only modest economic gains.
In our work, we looked at the impact of a 20 minute reduction in travel time between Leeds and Manchester. We find that closer integration between Manchester and Leeds could be expected to have a positive effect on wages. Our largest estimate, for a 20 minute reduction in train journey times between Leeds and Manchester, has average wages increasing by between 1.06% and 2.7%.
These numbers come with some important caveats (discussed in more depth here). First, they are certainly not additional for the UK as a whole because a lot of this effect would come from the fact that Manchester and Leeds will be attracting activity that would have gone elsewhere (and not necessarily to London). Second, and related, the effects for an individual worker, with given and unchanging characteristics (often called place-based effects), are smaller at somewhere between 0.20 and 0.50 of a percent.
In short, joining up our Northern cities (particularly Manchester and Leeds) using HS3 would help, but it would be expensive and it's unlikely that it would be enough to provide an effective counterbalance to London.
It is also important to note that a project like HS3 to link cities may not be as effective as other interventions. For example, in the detailed report for Northern Way (rather than the more widely quoted summary) we tried to use the same methodology to compare the effect of a 1% reduction in travel times within Manchester or Leeds to the effect of a 1% reduction between those two cities. In all cases, within city reductions in travel times lead to larger increases in 'economic mass' (sometimes two to three times larger). As it is these changes in economic mass that underpin any estimated productivity effects, this tells us that a 1% reduction of within city costs would have a larger effect than a 1% reduction of between city costs. Of course, that doesn't tell us whether we should prefer one over the other - that would depend on the relative costs of achieving these cost reductions (which we didn't look at). But it does serve to reinforce the point that it might be difficult to replicate London's advantages from scale and proximity simply by joining up different cities. It also highlights the crucial point that we need to consider the alternatives before rushing headlong for the HS3 solution. I'd argue that this was a mistake we made with HS2 - best not to repeat it.
Of course, part of the attraction of creating a northern powerhouse by joining up cities is that it dodges a very difficult political problem. If balancing the effect of London requires, instead, somewhere 'big and Northern' that raises the very difficult question of where that place might be? Politics being what it is, I can see why many people (myself included) would prefer to dodge that particular question
Wednesday, 4 June 2014
Spatial Inequalities in Commuting Times
[Posted by Prof Henry G. Overman]
My bus journey in to work this morning took 90 minutes for 5 miles (due to arrangements for the Queen's Speech). Usually it takes around an hour on the bus. I can run it in 40 minutes and ride it in 25 (my preferred modes of transport).
My reasons for mentioning this is that it got me thinking about my comments yesterday on transport spending across different areas. Towards the end of that piece I wrote as follows: "Why do we care about the balance of infrastructure expenditure per se? Surely we care about the provision of transport services, broadly defined. Is it fair to invest in areas with low congestion at the expense of investment in areas with high congestion just to ensure that expenditure is equal? Why should we invest equally in places with no or slow population growth at the expense of places that are seeing high and continued growth in population? Why do we need as much investment per head in towns with a population of 100,000 as we do in cities with populations of millions?"
Inspired by my journey to work this morning, I went and took a look at the National Travel Survey to find out just how large is the variation in travel to work times by region. I've copied and pasted them below (where I've also added times for the average business trip). The variations across regions are pretty striking. The average Londoner spends around 41 minutes commuting compared to 23 minutes in the North East. Assuming 252 business days and 30 days annual leave that equates to a difference of 7992 hours (or 5.5 days) per year. These numbers aren't perfect (I'd like to see them income adjusted for example) but they point to huge variations in journey times. I am not in an way suggesting that these figures are 'unfair' but they paint a very different (and arguably more informative) picture than that coming from the figures on transport expenditure per capita.
| Commuting | Business | |
| Region of residence: | ||
| North East | 23 | 37 |
| North West | 25 | 35 |
| Yorkshire and The Humber | 25 | 38 |
| East Midlands | 23 | 35 |
| West Midlands | 25 | 40 |
| East of England | 29 | 43 |
| London | 41 | 44 |
| South East | 30 | 41 |
| South West | 23 | 37 |
Tuesday, 3 June 2014
Local Transport Expenditure
Lots of coverage for the Transport Committee's latest report on local transport expenditure.
I've had a quick read through of the report. Some of it makes sense. For example: there's been lots of change in funding schemes so it would be a good idea of DfT makes sure this isn't delaying delivery or reducing accountability. They also make the point (which I have made before in the context of Heseltine) that: "It is questionable whether bidding for pots of central government money that will be allocated via rules set by central government amounts to genuine devolution." No arguments from me there.
But the headlines all pick up on the recommendation that transport outside London should be funded better: "The under-funding of transport projects outside Greater London in recent years cannot be allowed to continue. Ministers must use the new funding arrangements, via the Local Growth Fund, to ensure that there is a fairer allocation of funding to transport projects beyond London, and not just in city regions, City Deal areas and current enterprise zones. No area across our nation should be second class in relation to the allocation of transport infrastructure funds".
The evidence for this under-funding comes in two parts. The first part quotes Baroness Kramer on actual expenditure - London gets about twice as much public expenditure per head as the rest of the UK (part of which is due to cross-rail). This figure is probably misleading because it compares a specific city to a set of regions. If you took, say, expenditure in Manchester it would be interesting to see how much closer it got to the London per capita level. No matter, because the second part of the argument uses the incredibly misleading IPPR North figures which talk about disparities in future funding streams of £2,500 per head in London to £5 per head in the North East. No adjustment would make those look equal.
Regardless of the exact amount, let's take at face value that there is some spatial unevenness in public expenditure in transport spending per head. The transport select committee implies that this is a bad thing and that the government should be seeking a more equal distribution. This begs the question, "why should funding be more equal"? The answer to that can come in two parts - either the current allocation is inefficient or it is inequitable.
In terms of efficiency a big part of the disparity between total and public expenditure (which would be larger than the two to one figure that I reported above) comes about because private sector expenditure goes disproportionately to London and the South East. Government doesn't have much control over those private sector flows but it's clear that public sector expenditure is more evenly spread. Taking a narrow view of the economic returns on public sector transport investment this suggests that it might be efficient to have it more concentrated, not less.
Of course, government doesn't take a narrow view. It thinks about the social returns as opposed to the private returns that drive private sector investment. Might the social returns be larger outside of London and the South East justifying a more equal distribution? Again, the answer is probably no from an economic cost-benefit point of view - the wider economic benefits that are captured in transport appraisal tend to occur in more dense, productive places. In contrast, on a project-by-project basis it's almost certainly the case that there are some London schemes that look poor value for money relative to non-London schemes and vice-versa. But I haven't seen any evidence that this is true on average (which is what we should focus on if we care about shares of expenditure).
We could construct an efficiency argument for greater spending outside of London and the South East if we thought that this was vital for improving economic performance (or for turning economies around). But as Ed Glaeser has observed, places which have seen declining or low population growth usually have relatively high per-capita infrastructure stocks. [As evidence of this, note that journey times and congestion levels are significantly lower outside of London and the South East]. If this is the case, then further investments in transport will experience decreasing returns and won't do much to increase growth. To put it another way, if the problem comes from structural change, poor educational outcomes and skills that are no longer needed - why should increased transport investment provide a solution? Transport may be an issue in some of the more successful economies outside London and the South East - Manchester, Leeds, etc - but surely not everywhere?
If the efficiency arguments are weak, the equity arguments aren't great either. Why do we care about the balance of infrastructure expenditure per se? Surely we care about the provision of transport services, broadly defined. Is it fair to invest in areas with low congestion at the expense of investment in areas with high congestion just to ensure that expenditure is equal? Why should we invest equally in places with no or slow population growth at the expense of places that are seeing high and continued growth in population? Why do we need as much investment per head in towns with a population of 100,000 as we do in cities with populations of millions?
Worrying about the efficient and equitable use of transport expenditure is incredibly important. I'm certainly not arguing that we currently have it completely right. But simply asserting that we must have more equal expenditure does nothing to help us figure out whether and how we should be changing the current balance of funding.
Friday, 30 May 2014
Is Help to Buy 'working'?
Back in 2012, I proposed the following two step method for assessing housing policy initiatives:
1. How many people are likely to be affected?
2. If the policy affects relatively large numbers of people, what's the likely impact on the housing market?
If you want to solve the housing crisis you need the answer to (1) to be 'lots' and the answer to (2) to be 'does not increase house prices, but increases supply'.
On (1): Currently Help-to-Buy has assisted 7,313 people. This is not a lot.
On (2): If Help-to-Buy ends up helping a lot of people, it will increase demand, rather than supply. This will push up prices making housing less affordable.
In other words, if Help-to-Buy does 'work' it won't 'help'.
Thursday, 22 May 2014
Is there a London Housing Bubble?
The latest figures showing London house prices up 17% in a year can only fuel speculation about whether London is experiencing a housing bubble.
Tim Harford and Simon Wren-Lewis have both provided thoughtful commentary on this in the last few weeks (as, I am sure, many others). I don't have anything much to add to the debate on whether there is a bubble. As Tim Harford makes clear, I'm not sure how we'd know. But, to some extent, it seems to me that all this debate about whether or not there is a bubble deflects attention from the more fundamental point: highly inelastic housing supply leads to both high prices and greater fluctuation in prices.
Indeed, the last time my colleague Paul Cheshire looked at the figures, the volatility of the UK housing market as a whole exceeded the volatility of the most volative metropolitan market in the US (at the time, LA). The recent housing market problems in the US may have changed the relative volatility for a few metro areas short term - but with London growing at 17% it won't be long before we reclaim our 'crown'.
Highly inelastic housing supply adds to volatility because any increase in demand gets translated in to rapidly rising prices. Whether that demand comes from income growth, lower mortgage rates, easier borrowing, foreign buyers or some other structural shift, the result is large increases in house prices. This, in turn, tends to feed back in to demand as people come to expect capital gains. When structural factors shift in the opposite direction, or expecations change falling demand now translates in to falling house prices. Result - high volatility.
Even in Simon Wren-Lewis view of the world, where the underlying shift in demand reflects low expected yield on other assets (rather than a bubble), it's still the highly inelastic markets that will see the large capital inflows. At the very least, if supply was more elastic, this inflow of capital would lead to increased housing supply, lower longer run rents and more affordable housing.
Is there a bubble? Who knows? But let's try not to have arguments around that question detract from the far more fundamental question of what we can do to try to increase housing supply in the parts of the country where demand is high.
Thursday, 15 May 2014
Building Reliant Robin Houses adds to our Housing Crisis
Posted by Paul Cheshire, LSE and SERC
We all know
there is a housing crisis. The latest data show that on the best measure of affordability (the price of a house mid-way in
the price range relative to earnings mid-way in the range), the national
position is half 1997 levels and not a
lot better than at the worst point in 2007.
The debate
about causes is full of myths, many self-serving - such as the claim that weare in danger of concreting over England. As I showed in a recent article, the
reality is that Greenbelts cover more than 1.5 times all our built- up areas
put together. Surrey has more land for golf courses (2.65%) than for actual
houses (2.06%).
The most
important reason for the crisis is that we have been drastically restricting
the amount of housing land since 1947. Furthermore the recent changes embodied
in the National Planning Policy Framework, far from increasing the take of ‘Greenfields',
seem to have done the opposite. House completions have increased from the
catastrophically low levels of 2009 but housing starts – what is in the
pipeline – have fallen by nearly 10% and planning applications are
flatlining.
There are
problems of market failure, and land markets fail more than most. So they need
regulation, which is what planning should do. But effective regulation also needs
to be informed by an understanding of how markets work. The problem is that our
planning system seems to proceed as if it could entirely suspend the laws of
supply and demand.
It is not
just that restricting the supply of something when demand is rising (in this
case land when incomes and population have been rising) causes the price to go
up. But if you persistently build Reliant Robins and people prefer VWs, then
VWs become a luxury good and unaffordable. Roughly speaking, that is what we have been
doing with housing supply. We have not just been restricting the supply of land
to build them on but we have persistently been building the wrong sort of
houses in the wrong sort of places.
Houses do
not move about. So demand is local - primarily where there are decent jobs. But
also the evidence shows that as people get richer they try to buy more space (VWs rather than Reliant
Robins) with a bit of garden and somewhere to put their VW.
We may wish
to persuade people to use cars less and revive the prosperity of declining parts
of the country. But it is insanity to
try to achieve those objectives by refusing to allow houses to be built where
there are jobs, where they are most expensive and without reasonable space. When
lobbyists for the Greenbelt claim there is an ample supply of brownfield sites,
not only do they fail to recognise that brownfields are a legal concept
including some of the highest quality amenity land in Britain but not much of it is where job prospects are good.
This is true
even within southern England. Corby in Northants has a brilliant record ofbuilding houses.
Daventy in Northants does not. Corby has the most affordable houses in
Northants while Daventry the least. The unemployment rate in Daventry is less
than half that in Corby (link). A similar tale can be told of Lancashire comparing
Preston and Ribble Valley; or Watford compared to Three Rivers in Hertfordshire;
or Aylesbury Vale compared to Chiltern in Buckinghamshire.
All over the
country more houses are going up where they are already least unaffordable and
where unemployment is high relative to surrounding areas. London illustrates
this perfectly. Not only are we concentrating new building on the land most
exposed to flooding and rising sea levels in the East Thames Corridor, but as the table below shows, we are building them
where they are already least unaffordable and where job prospects are worst.
London Boroughs: The builders versus the non-builders
Mean % addition to stock 2004-12
|
Affordability Ratio (median house
price/median earnings
|
Unemployment Rate 2012/13
|
|
4 biggest builders1
|
14.57
|
9.98
|
11.35
|
4 smallest builders2
|
2.11
|
15.07
|
6.75
|
1 Islington, Hackney, Southwark & Tower Hamlets
2 Kensington & Chelsea, Merton,
Bexley & Sutton
And it is
not just across broader areas that there is this focus on building houses in
the wrong places. It is within cities too. In my new book with Max Nathan and Henry Overman, I give a striking example. In 2009, the West Midlands Regional Spatial Strategy was being discussed in a public hearing. When the local planners were asked why the plan was not allowing
building in more suburban areas, at lower densities, the answer was that if
sites like that were available developers would just ‘cherry pick them’. In plain English that means that developers
would try to build the sort of houses people wanted to live in the places they
wanted to live. So obviously we should not let them do that.
All this
means that we have far too many Reliant Robins and not nearly enough VWs in our
housing stock. Except when it comes to housing, housing Reliant Robins are even
less mobile than the real things. Not only are our houses inferior in terms of
type and space, they are in the wrong places.
Subscribe to:
Posts (Atom)